

|
SUMMARY:
In the MarketingSherpa Chart of the Week newsletter, we’ve brought you 47 articles this year to keep you updated on the latest research on consumer behavior and marketing practices.
For this week’s article, we are looking back at the most viewed charts of 2015 and sharing the data and insights your marketing peers were most interested in. Read on for information about conversion rates, consumers’ preferred communication channels, email frequency and subject line length. |
Click here to see a printable version of this chart
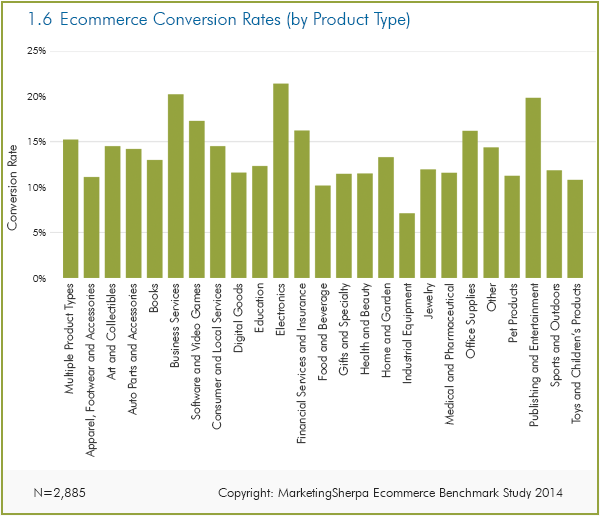
#ConsumerElectronics & video games among products with highest conversion rates in #ecommerce http://t.co/TjUyrEO1mF http://t.co/YpybW0juAl
— Goodvidio (@goodvidio) October 1, 2015What is an acceptable conversion rate? Fascinating chart showing different sectors: http://t.co/VHFqeUK2yD
— michaelhoresh (@michaelhoresh) August 13, 2014Conversion Rates for 25 retail categories - you higher or lower? http://t.co/ztIvOV4CnV http://t.co/8z2BubnFX8
— Kyle Aspinall (KJ) (@kylejaspinall) August 14, 2014
Click here to see a printable version of this chart
Marketing Research Chart: How do customers want to communicate? http://t.co/T4gVwMUsCG WTF. How is postal mail #2?
— Mike Kaput (@MikeKaput) May 19, 2015How do customers want to communicate? Email and snail mail! http://t.co/UjmgPxwliQ #emailmarketing #digitalmarketing
— Kirsti Scott (@kirstiscott) February 7, 2015People prefer email for communications from companies (expected.) But in second place? Postal mail (unexpected!): http://t.co/uHoJvpaP8h
— Forest Linden (@forestlinden) February 11, 2015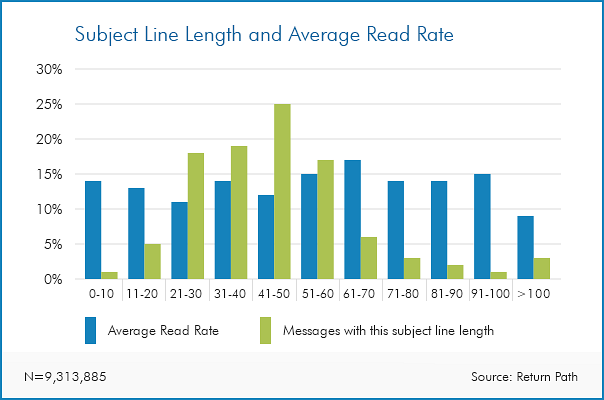
Click here to see a printable version of this chart
Surprise! Longer subject lines may be better. Open rates actually improve with length, despite conventional norms http://t.co/09nq7bg5Qs
— David K Hagan (@DavidKHagan) May 21, 2015It may not matter how long, but how enticing your subject line is. #emailmarketing #content https://t.co/pjypD0loX7
— John Agoglia (@WriteOneContent) May 20, 2015Don't be afraid of longer subject lines. @MarketingSherpa looks at how length affects open rates: http://t.co/IWPAMKEpSn
— Sue Horner (@SueHorner) May 19, 2015
Click here to see a printable version of this chart
Key = to ask them: How often customers want to receive promotional emails via @MarketingSherpa http://t.co/lnvfAAzXuF #email #marketing
— Erika Heald (@SFerika) February 20, 2015Customers say, "Don't email me daily!" http://t.co/z58P1lTCFK
— DMEdelivers (@DMEDelivers) February 13, 201586% customers want monthly promotional emails. 60% weekly. 15% daily. http://t.co/EWHwiToJW5
— Jeff Erickson (@ericksonjb) February 12, 2015Consumers want emails with promotional/sales content. http://t.co/upyulCUIMW http://t.co/WFwrvmi2XA
— allisonlaux (@allisonlaux) February 12, 2015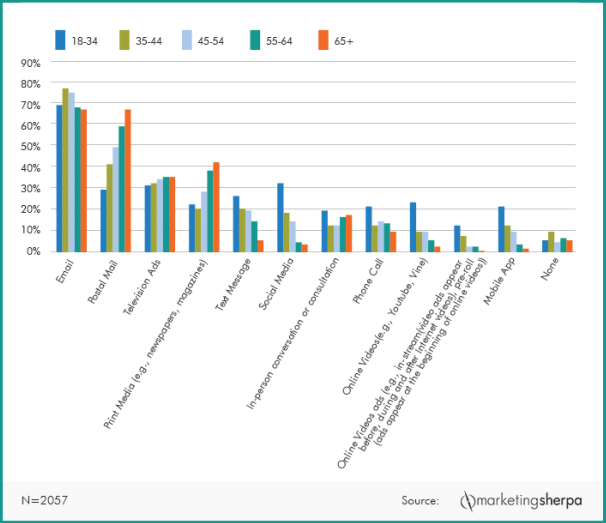
Click here to see a printable version of this chart
78% of 35-44 year olds prefer to receive emails over mail from companies http://t.co/rLMdzRPzdT #EmailMarketing
— CiG (@CiG_NA) March 16, 2015My daughters ask how can I have an email job. Nobody uses it. Well, you will. http://t.co/CBsTVUNuR8 @MarketingSherpa pic.twitter.com/d6X1P9c954
— Massimo Arrigoni (@massiarri) March 11, 2015
Join our thousands of weekly case study readers.
Enter your email below to receive MarketingSherpa news, updates, and promotions:
Note: Already a subscriber? Want to add a subscription?
Click Here to Manage Subscriptions
Get Better Business Results With a Skillfully Applied Customer-first Marketing Strategy

The customer-first approach of MarketingSherpa’s agency services can help you build the most effective strategy to serve customers and improve results, and then implement it across every customer touchpoint.
Get More Info >MECLABS AI

Get headlines, value prop, competitive analysis, and more.
Use the AI for FREE (for now) >Marketer Vs Machine

Marketer Vs Machine: We need to train the marketer to train the machine.
Watch Now >Live, Interactive Event

Join Flint McGlaughlin for Design Your Offer on May 22nd at 1 pm ET. You’ll learn proven strategies that drive real business results.
Get Your Scholarship >Free Marketing Course

Become a Marketer-Philosopher: Create and optimize high-converting webpages (with this free online marketing course)
See Course >Project and Ideas Pitch Template

A free template to help you win approval for your proposed projects and campaigns
Get the Template >Six Quick CTA checklists

These CTA checklists are specifically designed for your team — something practical to hold up against your CTAs to help the time-pressed marketer quickly consider the customer psychology of your “asks” and how you can improve them.
Get the Checklists >Infographic: How to Create a Model of Your Customer’s Mind

You need a repeatable methodology focused on building your organization’s customer wisdom throughout your campaigns and websites. This infographic can get you started.
Get the Infographic >Infographic: 21 Psychological Elements that Power Effective Web Design

To build an effective page from scratch, you need to begin with the psychology of your customer. This infographic can get you started.
Get the Infographic >Receive the latest case studies and data on email, lead gen, and social media along with MarketingSherpa updates and promotions.
