by
Daniel Burstein, Director of Editorial Content, and
Dr. Liva LaMontagne, Editorial Research Manager
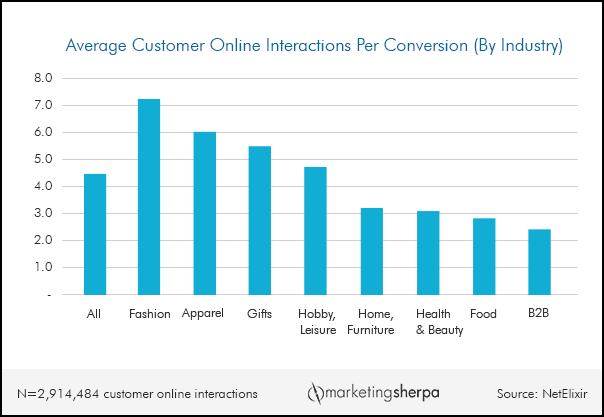
NetElixir studied 2,914,484 online customer interactions (or "touches") leading to 522,074 conversions on its clients' sites across eight industry sectors, ranging from apparel and leisure to food and B2B.
The online agency studied conversions that occurred between January 1 and April 30, 2015, with a 90-day look back period, using a set of custom channel definitions. The resulting dataset has more than 89,000 different conversion paths, including every conceivable combination of channels, ranging from single-step paths to paths with over 300 steps.
Click here to see a printable version of this chart
Fashion retailers have the most interactions with customers before conversions
Not surprisingly, the number of customer interactions varied by industry, ranging from 2.4 for B2B sites to 7.3 for fashion retailers.
We expected to see a fewer number of interactions leading to simpler sales. Apparel products, for example, typically have low costs and, therefore, less risk. In complex sales like B2B transactions, we expected to see a higher number of interactions due to the higher costs and potential losses involved with those purchases.
However, the data reflects a more complicated view of the customer journey, since fashion retailers had the highest customer-interaction-per-conversion (7.3), and B2B had the lowest (2.4).
These results correlate well with previous advice we've given in MarketingSherpa's Chart of the Week.
In
a previous Chart of the Week, David Brussin, Chairman and Founder, Monetate, advised "Low conversion rates in retail can be a sign of content consumption behavior … customers come in every day to read the latest, see the latest, see what products have been added and see what's new. They're not converting every day but they're coming every day. That relationship with the brand is so strong that they're coming every day to interact with the content and the product for that brand. And they're converting on an absolute basis a lot more often. So conversion rate may be shockingly low for a brand with content consumption behavior but revenue is off the charts high."
While complex sale products, like a B2B purchase, may be perceived as having more touches because of high costs and multiple stakeholders involved in the decision, high passion products (like apparel) can also have frequent and complex customer interactions for different reasons. This leads us to examine the limitations of online attribution data when evaluating the customer buying journey.
The limits of online attribution data
With regards to the low interactions number for B2B purchases, Don Rodriguez, Director of Analytics, NetElixir, pointed out that, because of the potentially extended time frames for these transactions, not all interactions would be captured within the 90-day look back period in the analytics platform used in this study.
Marketers must be aware that time-based analytics limitations will affect their view of the buyer journey, and scope-based limitations will have an impact as well.
While NetElixir analyzed data from all sources of online interactions (which, itself, may be broader than some marketers may be able to measure), offline interactions were not observed. The fact that offline marketing efforts can (and do) lead to online sales adds another layer of complexity to the task of building an attribution model for ecommerce companies.
For example, if marketers have a difficult time measuring offline interactions, they may fully attribute a sales to a pay per click advertisement on a search engine when, in reality, customers were initially led to make that search by a print advertisement in a newspaper, and clicked on the PPC ad because the previously viewed newspaper ad gave the brand some credibility.
Remove the untracked newspaper ad, and you lose the click and perhaps even the search.
Multi-touch attribution
In a perfect world, every marketer would have robust multi-touch attribution tracking and reporting capabilities for all interactions both online and off through the entire customer journey (no matter how long ago it started).
This would overcome the bias of assuming sales come from the last measured interaction or, conversely, crediting the final purchase from a customer to the first measured interaction that began the journey.
Perfectly accurate multi-touch attribution is the Holy Grail of modern marketing. Much like an asymptote (the curved line in geometry that approaches but never quite touches zero as it moves out towards infinity), your goal shouldn't be perfect attribution, but to get as close as possible to a deep omnichannel understanding of your customers' journeys and what investments you can make to facilitate those customer journeys.
How do you do that? Depending on the sales cycle of your products or services, whether it is short or long, different tactics might be helpful.
How to measure customer interactions in B2B (long sales cycle)
B2B companies can have a lot of customer interactions because of the multiple stakeholders involved, and the complexity of the products or service. Since those interactions can be distributed over a longer time period, the customer interaction per conversion number can appear lower. Rodriguez offered the following advice on how B2B ecommerce companies can approach multi-touch attribution:
- Use the information that the 90-day look back period provides. For B2B this period will capture interactions at the end of the customer journey. "There may be actionable insights to gain by studying what channels, campaigns, messages, keywords, etc., are involved in those final stages," Rodriguez said.
- Track past buyers. Compare conversion path lengths of repeat buyers versus first-time buyers to see if there are actionable differences.
- Add a user ID in your analytics platform, and build a "known" segment of your audience. If you attach a unique ID to every customer who submits a form or signs up for email newsletters and include that ID in your analytics platform, you will be able to track and analyze that user's past and future visits.
How to measure customer interactions in B2C (short sales cycle)
The sales cycle for purchases such as apparel is relatively short, but customers have frequent interactions with the brands. Looking at the fashion industry example, Ryan Phelan, Vice President of Marketing Insights, Adestra, pointed out that the different motivations fashion buyers have makes understanding and influencing of the sales process highly complex.
"If you look at the persona types of the fashion buyer, you have some that are driven by the brand name of the product and those that are driven by discount, and every facet in-between, including those that need to see it 'on them' before they buy," Phelan said, adding that "segmentation is a key tool in looking at conversion on a buyer-type level, not an aggregate group. It's only then that you can accurately look at conversion paths and deviations above and below that. The more complex the segmentation, the more accurate you are in measuring these types of metrics and affecting change."
Measuring what you can on the road to multi-touch attribution
In the NetElixir research report, 61% of revenue (35 million dollars) came from multi-touch conversion paths. That said, a considerable amount of revenue (39%, or 22.7 million dollars) could be explained with a single-touch model.
According to Rodriguez, this means that marketers have to conduct their own analysis to understand how conversion path length and revenue are related for their business. Although perfect attribution doesn't exist in nature, in Rodriguez's words, "measuring what you can is still better than giving 11% of your touchpoints 100% credit for the revenue streams they touched."
Here are three actionable tips on how to approach building your ecommerce company's online attribution model:
- Include all marketing-related expenses in your model. Although you won't be able to assign every customer's purchase to a channel, at least you will have metrics for gauging the effectiveness of your marketing investment.
- Consider that experimentation will take time. Try different models, but be prepared to accept the fact that your custom model might not perform significantly better than the default model (Rodriguez shows an example of this in the NetElixir study).
- Be a multi-dimensional marketer. Phelan advised marketers to examine how well they work outside their "box" of responsibility. "Reach out to other departments and not only coordinate efforts, but recognize that the SEO team can actually help the email team with subject lines or content," Phelan said, adding that "we've operated for too long in marketing silos and those need to break. The trade-offs are that you have to share your insights and take time out of an already hectic day to meet and coordinate. But, if we realize that last-click attribution will eventually go away, then we should start here today!"
Related resources
Subscribe to MarketingSherpa Chart of the Week — get the data and discoveries you need to better serve customers and improve results, delivered to your email
Mastering Attribution through Conversion Path Analysis (research report from NetElixir)
NetElixir's Analytics BlogAttributing Conversions to Assisting Keywords Lowers CPA: 5 Steps to Optimize BidsEcommerce Chart: How a low conversion rate can be a good thingImprove Revenue Attribution: 5 Insights to Recognize the Impact of Contributing ChannelsWhat is "Direct Traffic"? (by Rocky on The WebTrends Outsider)
Adestra BlogMarketingSherpa Summit 2016 — At the Bellagio in Las Vegas, February 22-24


