

|
SUMMARY:
Facebook is the most used social network in the world. One way to get in front of this large audience is with video ads. How can you make an effective ad? Read on to learn what’s working (and not working) in Facebook video advertising. |
To help understand what makes an effective Facebook video ad, Buzztala evaluated 232 ad sets from 12 social campaigns run on Facebook between January 1 and May 31, 2016.
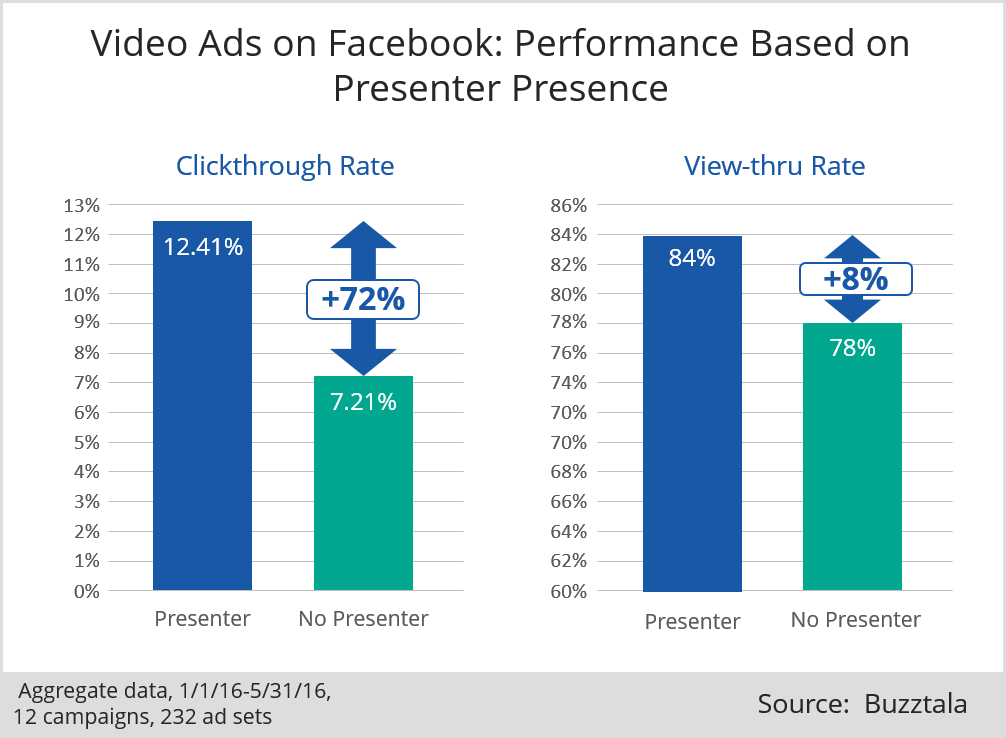
The first chart shows the effect on clickthrough rate and view-through rate of having a presenter on camera versus no presenter in the videos.
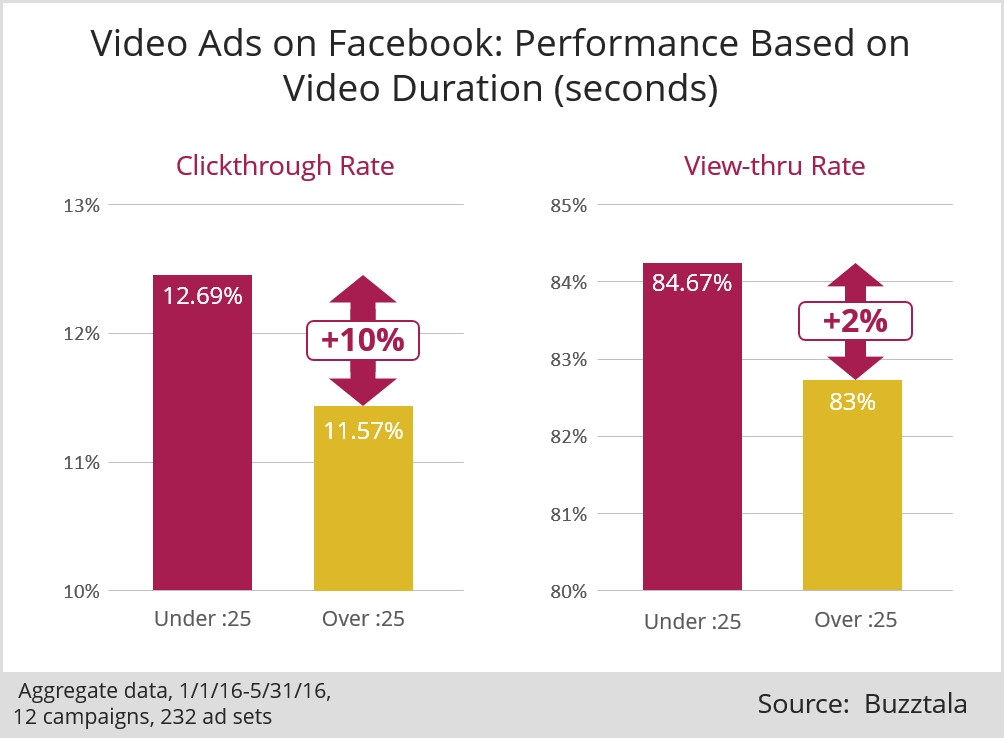
The second chart explores the same metrics for video length.
“Over time, we’ve found 25 seconds is the inflection point so we compare on either side of that,” said Jay DeDapper, CEO, Buzztala.
We sat down with Jay to discuss the data, along with what’s working (and not working) in Facebook video advertising.
The human connection made for the most effective videos on Facebook; having an on-camera presenter increased clickthrough rate by 72%. And videos under 25 seconds long received a 10% higher clickthrough rate than longer videos.
Inbound Marketing: 450% average ROI from Facebook advertising and organic content effort
Facebook Ads: How Zappos.com manages a $10 million strategy
Marketing Research Chart: How do customers want to communicate?

Join our thousands of weekly case study readers.
Enter your email below to receive MarketingSherpa news, updates, and promotions:
Note: Already a subscriber? Want to add a subscription?
Click Here to Manage Subscriptions
Get Better Business Results With a Skillfully Applied Customer-first Marketing Strategy

The customer-first approach of MarketingSherpa’s agency services can help you build the most effective strategy to serve customers and improve results, and then implement it across every customer touchpoint.
Get More Info >MECLABS AI

Get headlines, value prop, competitive analysis, and more.
Use the AI for FREE (for now) >Marketer Vs Machine

Marketer Vs Machine: We need to train the marketer to train the machine.
Watch Now >Live, Interactive Event

Join Flint McGlaughlin for Design Your Offer on May 22nd at 1 pm ET. You’ll learn proven strategies that drive real business results.
Get Your Scholarship >Free Marketing Course

Become a Marketer-Philosopher: Create and optimize high-converting webpages (with this free online marketing course)
See Course >Project and Ideas Pitch Template

A free template to help you win approval for your proposed projects and campaigns
Get the Template >Six Quick CTA checklists

These CTA checklists are specifically designed for your team — something practical to hold up against your CTAs to help the time-pressed marketer quickly consider the customer psychology of your “asks” and how you can improve them.
Get the Checklists >Infographic: How to Create a Model of Your Customer’s Mind

You need a repeatable methodology focused on building your organization’s customer wisdom throughout your campaigns and websites. This infographic can get you started.
Get the Infographic >Infographic: 21 Psychological Elements that Power Effective Web Design

To build an effective page from scratch, you need to begin with the psychology of your customer. This infographic can get you started.
Get the Infographic >Receive the latest case studies and data on email, lead gen, and social media along with MarketingSherpa updates and promotions.
