August 19, 2008
Article

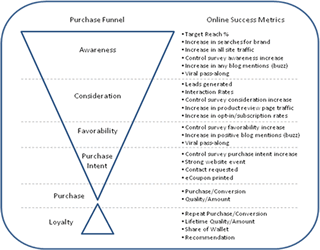
New Chart: Match Your Metrics to the Best Prospects in the Purchase Funnel

SUMMARY: Metrics can help you locate where your prospects lie in your purchase funnel. But you need to focus on the right metrics for your organization – those that you can rely on for the most meaningful and accurate information and insight.
Mapping Metrics With The Purchase Funnel

View Chart Online


Click here to see larger, printable version of this chart


This table lays out some – yes, just some – of the metrics that you can use to understand your purchase funnel and where in that funnel your prospects lie. Most marketers aren’t in a position to collect or work with all of these metrics. So, it’s important to focus on those that your organization is going to use as benchmarks and points of learning.

Before getting into what each of these metrics means, take a moment to think about the metrics you track, and the answers to these two questions:

1. Are you tracking metrics that give you some insight into each of the major steps in the purchase funnel? Many companies are heavy on awareness and purchase, but light on consideration and favorability, for example.

2. Can you track these metrics with accuracy? It seems simplistic, but many times we are forced to use metrics that are one step removed from the process. For example, using clicks instead of conversions is common when conducting page tests. If you base your business direction and investment on a Web metric, make sure it’s one you can rely on.

Purchase Funnel Success Metrics

o Target reach percent: Using composition data from a service, such as comScore, determine how many impressions out of total served went to target, then divide by target reached by total target population.

o Increase in searches for a brand: Major search engines can provide this data.

o Increase in all site traffic: Site analytics can provide this data.

o Control survey increase: Ad effectiveness study simultaneously gathers and compares unexposed to ad-exposed audience to determine increase.

o Increase in any blog mentions (buzz): Nielsen Buzzmetrics, or another monitoring service, can determine the general level of brand-specific online chatter.

o Viral pass-along: Using pixel tracking on distributed media, or by using internally hosted content, determines how many impressions beyond bought impressions can be attributed to consumers passing marketing to others.

o Leads generated: Number of leads attributable to ads.

o Interaction rates: Rate of interactions with interactive ads to all ads served. May want to determine unique interaction rate by dividing by unique individuals reached instead of all ads served.

o Increase in product review page traffic: a simple tracking tag or bought button on an external product review page can show increases; alternatively, just ask review site for data.

o Increase in opt-in/subscription rates: Number of opt-ins attributable to ads.

o Increase in positive blog mentions (buzz): Buzz monitoring service can determine the general level of brand-specific online chatter, and filter out negative comments.

o Strong website event: For brick and mortar store, events like printing directions to a local store would count. Will differ depending on website.

o Contact requested: Number of contact requests attributable to ad.

o eCoupon printed: Number of ecoupons printed; if possible, number redeemed.

o Purchase/Conversion: Number of purchases or conversions attributable to ad.

o Quality/Amount: Qualitative metrics such as dollar amount purchased help determine where most valuable audience is coming from. Important for sellers with very different products.

o Repeat Purchase/Conversion: Number of repeat conversions.

o Lifetime Quality/Amount: Lifetime value of customers.

o Share of Wallet: $$ spent on your product vs. $$ spent on competitors’ products.

o Recommendation: Similar to viral pass-along, but limited to existing customers.

Useful links related to this article

Not a Subscriber to Sherpa's Chart of the Week? Click Here to Get a New Chart Delivered to Your Inbox Every Tuesday!
http://s-ivp0s-42988.sgizmo.com

More Research Data from Sherpa:
https://www.marketingsherpa.com/membertour.html?view=research

MarketingSherpa’s 5th Annual Business Technology Marketing Benchmark Guide 2008–09:
http://www.sherpastore.com/btbmg09.html

Improve Your Marketing

Join our thousands of weekly case study readers.

Enter your email below to receive MarketingSherpa news, updates, and promotions:

Note: Already a subscriber? Want to add a subscription?
Click Here to Manage Subscriptions