January 09, 2007
Article

CHART OF THE YEAR: 26 Different Ad Spends Compared (Online & Offline) -- From Billboards to Search Ads

SUMMARY: How much do US marketers spend on paid search vs direct postal mail? How about newspaper ads vs network TV? Or email vs mobile marketing?


And what tactic is the most gargantuan spend of all? (No, it's not TV, even if you include cable.)


MarketingSherpa has created two new Charts of the Year (one for offline ad spend and one for online ad spend) to give you perspective into the real world of marketing. Prepare to be shocked at least a little:


Last year, after MarketingSherpa published a special report on the promotional products marketing -- an $18 billion industry -- we received several letters from surprised readers.

"$18 billion? Logo-ed pens and T-shirts are more than twice as big as search?!" asked one.

Well, yes. In fact, as you can see below, many marketing tactics are larger than search. In fact, many "old-fashioned" offline tactics are far bigger than all of online combined.

If you read the daily marketing press, you're deluged by ceaseless articles hyping the latest hot new tactic (podcasting, RSS, online video, Web 2.0, you name it …). It's enough to make you feel constantly, hopelessly behind the times, no matter how far ahead of the curve you really are.

That's why our research team decided to create the two charts you see below. They should function as a sort of “reality check” for marketing-tactic hype.

You'll find the charts, as well as footnotes on where we got each figure. (Please note: you may hotlink to this page on Sherpa but, please, do not reproduce it. That's breaking our copyright.)

Several numbers overlap. For example, some print ad spends may include an online portion that wasn't broken out. So, don't blithely add up all the numbers and assume you have a total for all ad spend in the US last year. In every case, we used the most trusted number at the latest date. Some numbers are for 2005, some are for mid-2006, some estimates for all of 2006 are based on late fall data.

Yes, we will be adding to and updating these charts as the year goes on. They are living documents. If you have analysis or input, we hope you'll post to the charts via our Comments below. Thanks!


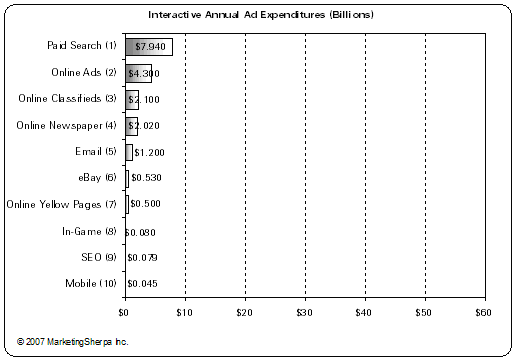
Chart #1. Estimated US Annual Interactive Ad Expenditures (2005/2006)

MarketingSherpa.com

1. MarketingSherpa Search Marketing Benchmark Survey, August 2006, Merrill Lynch Internet Advertising Report, June 2005, Piper Jaffray Internet Industry Report, January 2006, http://www.marketingsherpa.com
2. Interactive Advertising Bureau Note: Includes rich media, sponsorship and slotting fees, 2005, http://www.iab.net
3. Interactive Advertising Bureau, 2005, http://www.iab.net
4. Newspaper Association of America, November 2005, http://www.naa.org
5. MarketingSherpa Email Marketing Benchmark Report, November 2006, http://www.marketingsherpa.com
6. eBay’s 2005 annual earnings report, includes revenue from Shopping.com, http://www.ebay.com
7. Yellow Pages Association, March 2006, http://www.ypima.com/
8. Promo Magazine, July 6, 2006, http://promomagazine.com
9. MarketingSherpa Search Marketing Benchmark Report, August 2006, indexed with data from Merrill Lynch Internet Advertising Report, June 2005, Piper Jaffray Internet Industry Report, January 2006
10. Mobile Marketing Association, http://mmaglobal.com/


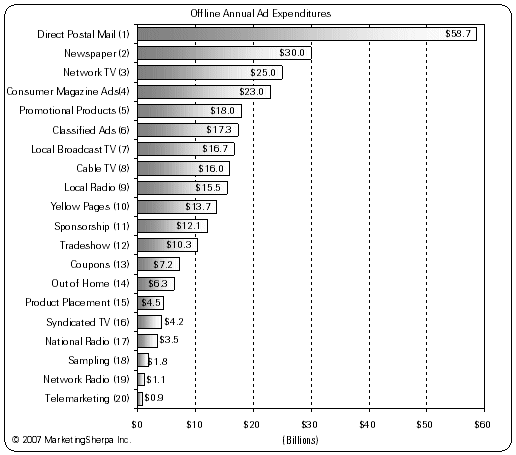
Chart #2. Estimated US Annual Offline Ad Expenditures (2005/2006)

MarketingSherpa.com

1. Direct Marketing Association Note: FY 2006, http://www.the-dma.org
2. Newspaper Association of America, November 2005. Note: includes National & Retail advertising, http://www.naa.org
3. Television Bureau of Advertising from estimates supplied by TNS Media Intelligence, March 2006. Note: Includes WB, UPN and PAX, http://www.tvb.org
4. Publishers Information Bureau, 2005, http://www.magazine.org
5. Promotional Products Association International, 2005, http://www.ppa.org
6. Newspaper Association of America, November 2005. Note: Print only, http://www.naa.org
7. Television Bureau of Advertising from estimates supplied by TNS Media Intelligence, March 2006. Note: Includes both local and national spot activity in the top 100 markets, http://www.tvb.org
8. Cabletelevision Advertising Bureau Note: Figure represents 2004-05 broadcast season, http://www.onetvworld.org
9. Radio Advertising Bureau, 2007, http://www.rab.com
10. Yellow Pages Association, March 2006, http://www.ypima.com/
11. PROMO Magazine, 'PROMO Industry Trends Report' for 2005, released April 2006, http://promomagazine.com
12. Center for Exhibition Industry Research, January 2006, http://www.CEIR.org
13. Promo Magazine, 'PROMO Industry Trends Report' for 2005, released April 2006, http://promomagazine.com
14. Outdoor Advertising Association of America Inc., 2005, http://www.oaaa.org
15. PROMO Magazine, 'PROMO Industry Trends Report' for 2005, released April 2006, http://promomagazine.com
16. Television Bureau of Advertising, 2005, http://www.tvb.org
17. Radio Advertising Bureau, 2007, http://www.rab.com
18. PROMO Magazine, 'PROMO Industry Trends Report' for 2005, released April 2006, http://promomagazine.com
19. Radio Advertising Bureau, 2007, http://www.rab.com
20. American Teleservices Association, 2005 Summary Report, http://www.ataconnect.org

Improve Your Marketing

Join our thousands of weekly case study readers.

Enter your email below to receive MarketingSherpa news, updates, and promotions:

Note: Already a subscriber? Want to add a subscription?
Click Here to Manage Subscriptions