The MarketingSherpa E-commerce Benchmark Study
The largest, most scientifically reliable study conducted on the state of e-commerce marketing
Where are successful e-commerce companies investing marketing budgets? How are e-commerce marketers attracting new customers? The MarketingSherpa team spent 3,000 hours trying to answer questions like these to arm you with the data you need to make key business decisions and gain budget and resources from business leaders and clients.
Get a Free Copy of the
Benchmark Study Now
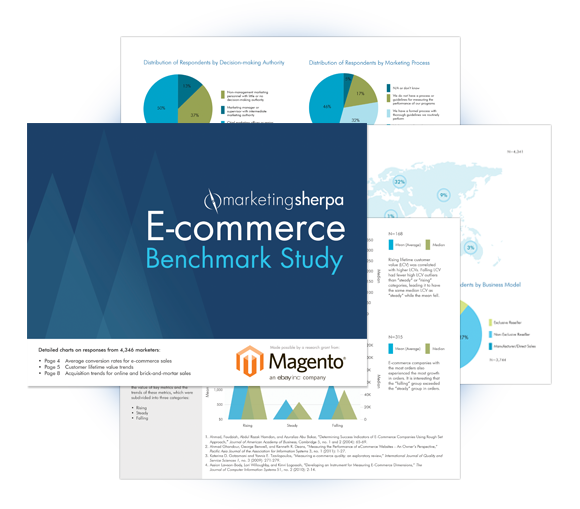
- Conducted with 4,346 e-commerce marketing professionals
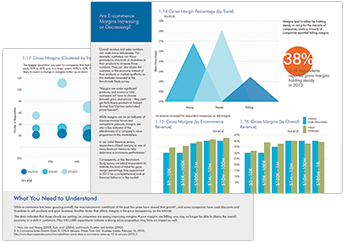
- 95 charts including cross-tabulated data on the most successful e-commerce marketing practices
- Distilled from more than 3,000 hours of research from a range of e-commerce experts, leaders and practitioners
Table of Contents
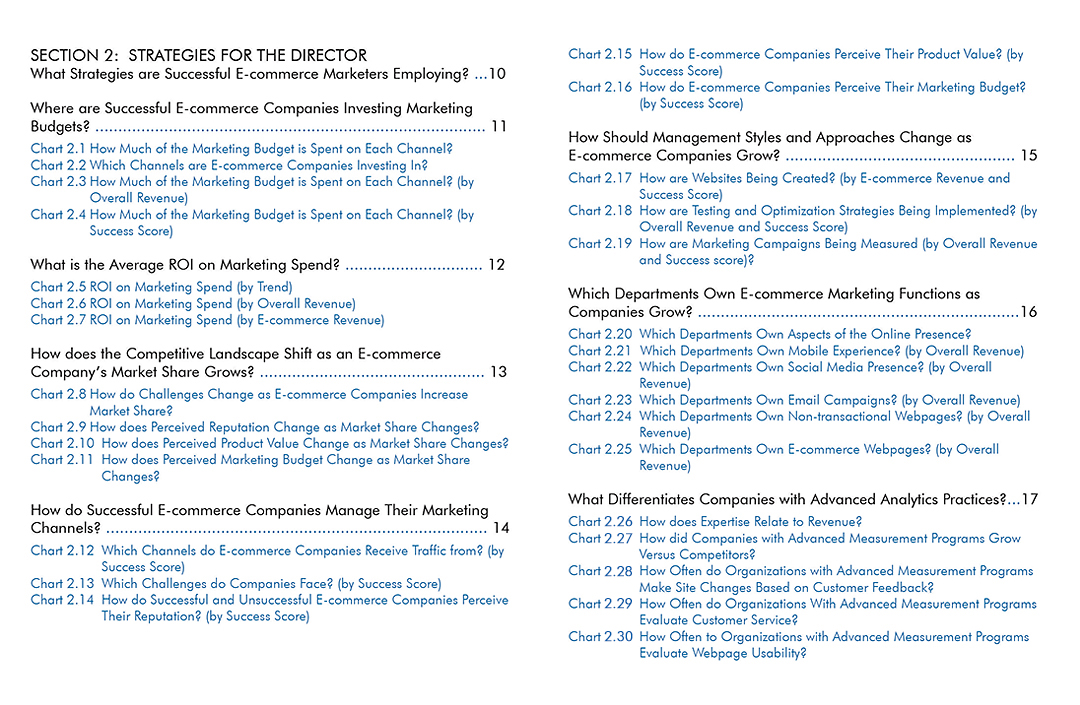
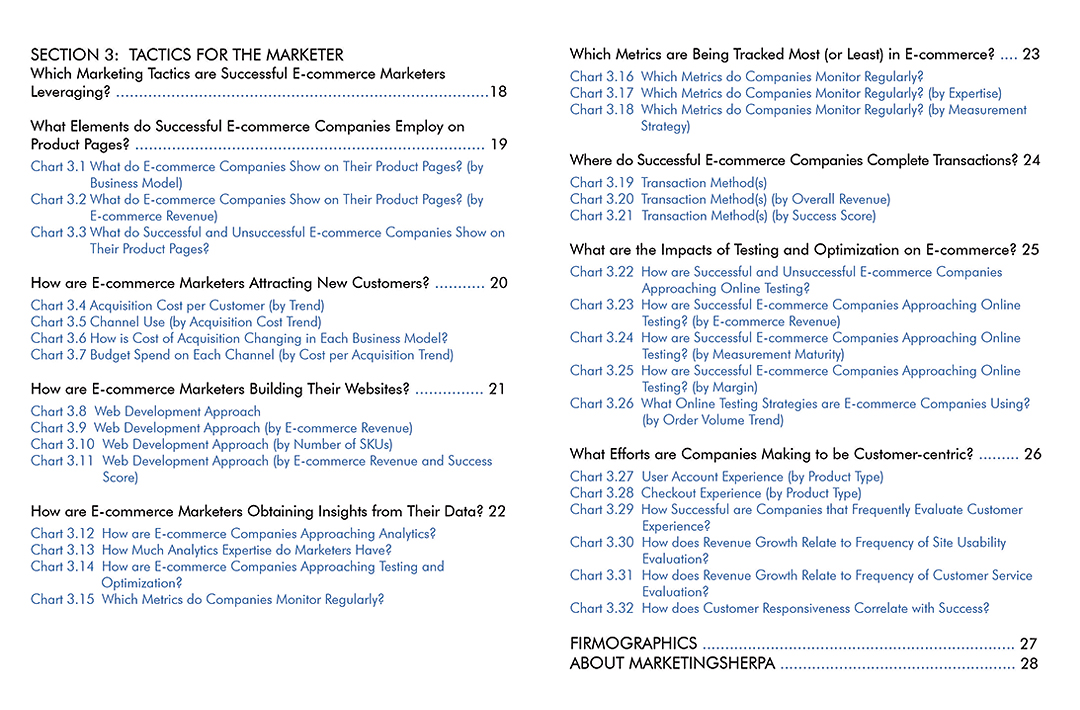
This comprehensive study contains answers to
25 of the most important questions in e-commerce
More than 4,000 of your e-commerce peers were scientifically sampled to distill key insights including:
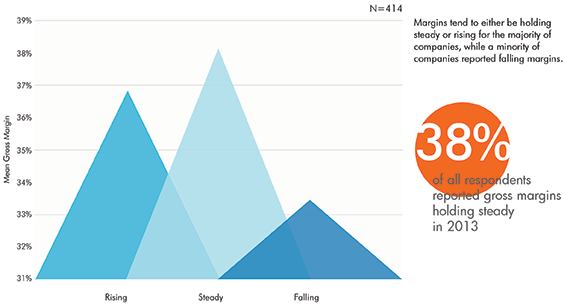
1. What is happening to the e-commerce landscape?
2. Which strategies are successful e-commerce companies employing?
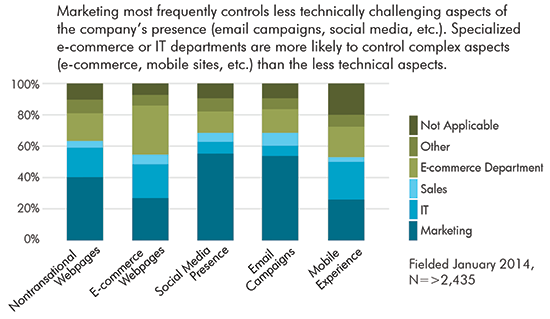
3. What marketing tactics are successful e-commerce marketers leveraging?
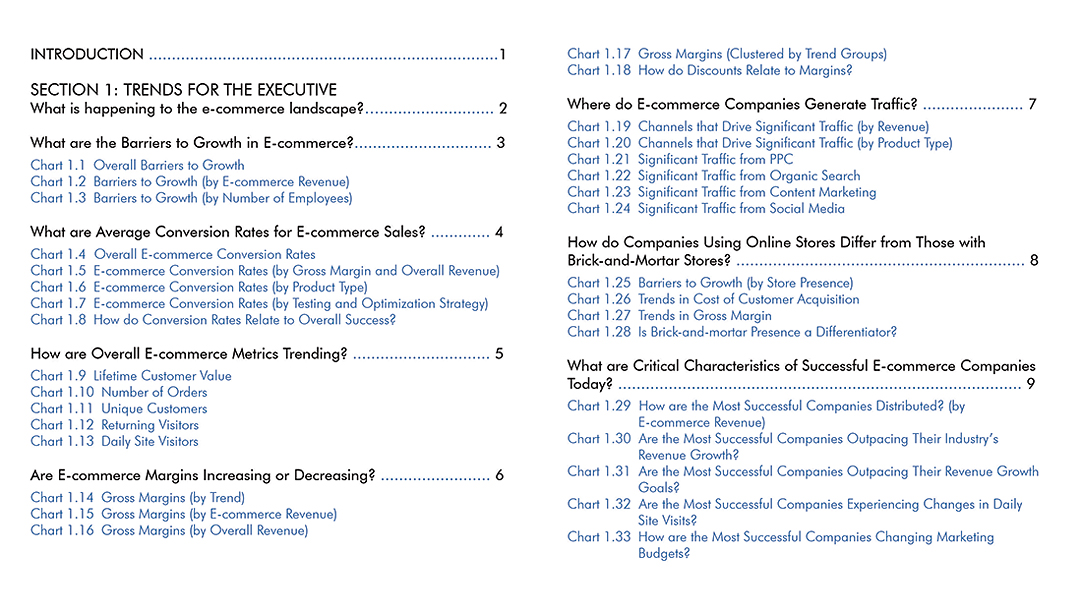
E-commerce Trends for the Marketing Executive
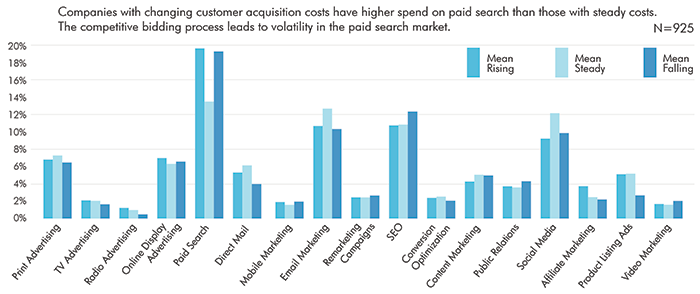
E-commerce is a rapidly evolving industry. In this study, MarketingSherpa identified key trends based on research into the practices of more than 4,000 marketers to help you answer questions like:
- What is happening to the e-commerce landscape?
- Where are the barriers to growth in e-commerce?
- What are average conversion rates for e-commerce sales?
- How are e-commerce overall website metrics trending?
- Are e-commerce margins increasing or decreasing?
E-commerce Strategies for the Marketing Director
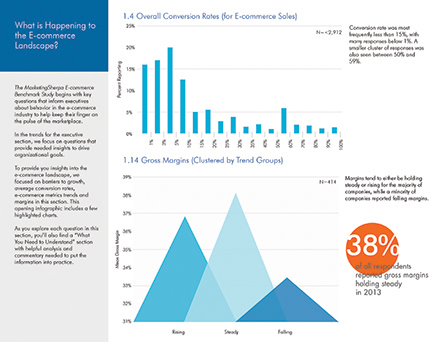
From budgets to marketing channel selection, e-commerce marketing directors are faced with key decisions to improve overall performance. To help you create an effective strategy, this section answers questions like:
- Which strategies are successful e-commerce companies employing?
- Where are successful e-commerce companies investing their marketing budgets?
- What is the average ROI on marketing spend?
- How does the competitive landscape shift as an e-commerce company's market share grows?
- How do successful e-commerce companies manage emerging marketing channels?
E-commerce Tactics for the Marketing Manager
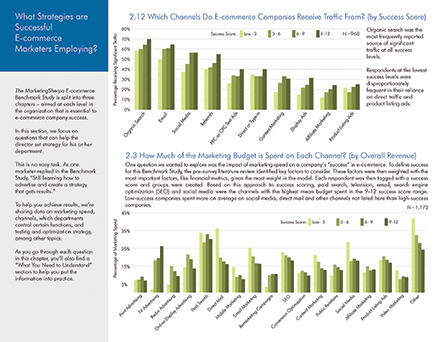
To execute successful campaigns, you need more than just know-how— you need resources. This section provides both, and helps you make your case to gain budget approval by answering questions like:
- Which marketing tactics are successful e-commerce marketers leveraging?
- What elements do successful e-commerce companies employ on product pages?
- How are e-commerce marketers attracting new customers?
- How are e-commerce marketers building their websites?
- How are e-commerce marketers obtaining insights from their data?
Research Methodology
MarketingSherpa fielded the E-commerce Benchmark study from January 16 to February 14, 2014.
The initial query began with a pre-survey academic literature review, consisting of peer-reviewed journals, interviews with e-commerce thought leaders and published surveys across a variety of academic, business and e-commerce research verticals.
Further query took the form of an online survey of e-commerce marketers. Certain responses were removed because they were not reasonable responses to the questions. Some responses were reformatted for consistency. After data cleaning, there were 4,346 qualified complete and partial responses from e-commerce marketing and business professionals across six continents.
The sampling method used was an incentivized non-probability voluntary sample composed of MarketingSherpa and Magento registered subscribers, and those responding to invitations promoted through social media platforms.
To ensure quality and relevance, submissions from respondents who indicated they were not engaged in e-commerce marketing were excluded. Results should, therefore, be interpreted in the context of that group. Comparison to those outside the e-commerce business and marketing community is beyond the scope of this publication.
The charts found within this Benchmark Study were selected for publication based on a combination of helpfulness of information to the audience and scientific validity. The number of responses, denoted with “N=” on each chart, and differentiation levels between respondent groups were both taken into account when determining the validity of charts.
Helpful insights may still be gleaned from highly differentiated but small response groups. However, each individual should use their own judgment when interpreting charts with a low number of responses. At times certain bars may have been omitted from bar charts because their category did not meet a desired number of responses.
Responses were tabulated in SAS JMP 11.1.1, and charts were prepared using Microsoft Excel and graphic design software. In many cases, responses of “not applicable” or “other” have been omitted from charts because they did not contribute to understanding the questions at hand. The incentive for participating in the survey was the chance to win a choice of an Apple iPad Air or MarketingSherpa Summit ticket (plus hotel stay at the Aria Resort), which was made available to a winner selected at random following the close of the survey.
Success Score Modeling
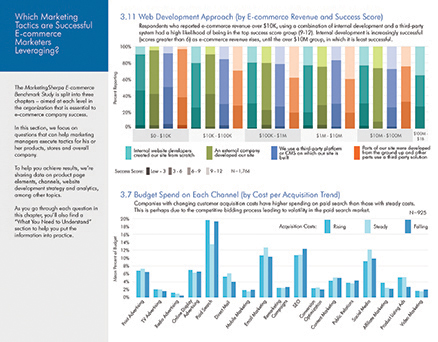
To define success for this Benchmark Study, the pre-survey literature review identified five key factors to consider: financial metrics, site design and performance, customer orientation, internal resources and capabilities, and competitive comparisons. Questions and combinations of questions were designed for the survey that would capture several aspects of each factor. These included but were not limited to:
- Year over year change in annual revenue
- Year over year change in e-commerce revenue
- Gross margin percentage
- ROI on marketing spending
- Trend in orders placed
- Trend in cost of customer acquisition
- Frequency of site change based on customer feedback
- Steps in the purchase funnel
- Competitive comparisons
- Customer guarantees
- Product value
- Delivery speed
- Market share
- Reputation monitoring processes
Relative- and trend-based factors were used instead of raw figures to score consistently for both small and large enterprises. These factors where then adjusted to a uniform scale with certain undesirable responses scored below zero.
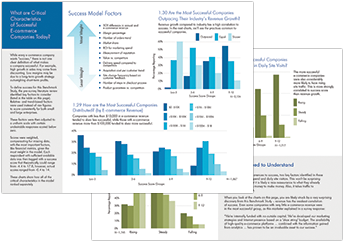
Scores were weighted, compensating for missing data, with the most important factors, like financial metrics, given the most weight in the model. Each respondent with sufficient available data was then tagged with a success score that theoretically could range from -4 to 18. However, measured scores ranged from -0.4 to 14.
To request further information about the design of this survey-based study, please contact our research team at: research@marketingsherpa.com.
